
 Price Prediction 2024-2030: Will OM Token Reach $5 Soon?")

Since its inception in 2020, MANTRA (OM) has gained significant traction in the blockchain and DeFi space. The platform’s integration of various DeFi services has made it a notable player in the market. Recent market activities reflect its dynamic growth and adaptation to the rapidly evolving crypto environment, with the token hitting its all-time high recently. MANTRA (OM) has been actively expanding its ecosystem through strategic partnerships and continuous protocol updates to enhance user experience and security.
MANTRA (OM) has seen substantial increases in its user base and transaction volumes in the past year. The platform’s native token, OM, has experienced fluctuations typical of the volatile crypto market, yet it maintains a strong presence among DeFi tokens. Its staking and lending services have attracted a significant amount of locked value, indicating trust and engagement from the community. MANTRA (OM) has also been focusing on improving its governance model, allowing for more efficient and transparent decision-making processes.
Table of contents
- MANTRA (OM) Real Time Market Status
- What is MANTRA (OM)?
- MANTRA (OM) Market Status
- MANTRA (OM) Price Analysis: Moving Average Convergence Divergence
- MANTRA (OM) Price Analysis: Relative Strength Index (RSI)
- MANTRA (OM) Price Analysis: Awesome Oscillator (AO)
- MANTRA (OM) Price Prediction 2024-2030
- MANTRA (OM) Price Prediction 2024
- MANTRA (OM) Price Prediction 2025
- MANTRA (OM) Price Prediction 2026
- MANTRA (OM) Price Prediction 2027
- MANTRA (OM) Price Prediction 2028
- MANTRA (OM) Price Prediction 2029
- MANTRA (OM) Price Prediction 2030
- FAQs
MANTRA (OM) Real Time Market Status
| 🪙 Name | MANTRA |
| 💱 Symbol | OM |
| 🏅 Rank | #302 |
| 💲 Price | $0.088591992773058 |
| 📊 Price Change (1h) | -1.12 % |
| 📊 Price Change (24h) | -5.59 % |
| 📊 Price Change (7d) | -13.15 % |
| 💵 Market Cap | $97621946.027822 |
| 💸 Circulating Supply | 1101927419.9859 OM |
| 💰 Total Supply | 1715057661.6086 OM |
MANTRA (OM) is currently trading at $0.088591992773058 and sits at number #302 on CoinMarketCap in terms of market capitalization. There are 1101927419.9859 OM coins currently in circulation, bringing the total market cap to $97621946.027822.
Over the past 24 hours, MANTRA has decreased by 5.59%. Looking at the last week, the coin is down by 13.15%.
What is MANTRA (OM)?
MANTRA (OM) is a decentralized blockchain ecosystem initially known as MANTRA DAO. The platform was built to leverage the benefits of decentralized finance (DeFi) and community governance. MANTRA’s architecture integrates several blockchain technologies to create a versatile and inclusive ecosystem. The platform operates on transparency, community control, and financial inclusion principles, offering various DeFi services such as staking, lending, and governance.
At its core, MANTRA (OM) employs a decentralized autonomous organization (DAO) model, which empowers its community members to have a say in decision-making. This governance model is fundamental to its operation, allowing token holders to propose and vote on important matters such as protocol upgrades, new features, and other significant changes. This participatory governance ensures that the ecosystem evolves according to its diverse user base’s collective interests and insights, fostering a sense of ownership and engagement among participants.
Additionally, MANTRA (OM) aims to create a seamless and integrated DeFi experience by offering various financial products and services. These include staking pools, lending platforms, and yield farming opportunities designed to provide users with numerous avenues for generating returns on their crypto assets. By integrating these features within a single ecosystem, MANTRA (OM) simplifies the user experience and enhances the potential for synergistic growth within the DeFi space. The ecosystem’s commitment to innovation and community-driven development positions it as a significant player in the evolving world of decentralized finance.
MANTRA (OM) Market Status
The MANTRA OM (OM) cryptocurrency has demonstrated volatility and bullish movement over the last 24 hours, as reflected in the price chart. The coin’s price began at approximately $0.94 and witnessed a sharp decline to a low of $0.9041 before rebounding and steadily climbing throughout the day. Ten hours ago, from the last recorded data, the OM token reached a new all-time high of $1.09, marking a notable peak in its recent price performance.

During the day’s trading, OM saw its price increase in a step-like progression, signaling strong buying pressure at each price level. This pattern culminated in the all-time high, after which the price has slightly adjusted to around $1.07. The chart shows a brief stabilization near the high, suggesting some resistance around the $1.09 mark.
In addition, OM’s trading volume has increased by 103.42% over the past 24 hours, reaching $151,623,904. This high trading volume indicates strong investor interest and activity in the token. The volume-to-market cap ratio of 19.56% underscores the active trading environment relative to its market capitalization, suggesting robust market engagement.
The market cap of OM stands at $851,519,142, ranking it #90 in the cryptocurrency market. The token demonstrates high liquidity with a circulating supply of 793,991,274 OM out of a total supply of 888,888,888 OM. The total value locked (TVL) is $1,140,954, resulting in a market cap to TVL ratio of 746.61613913. This high ratio reflects substantial market interest and confidence in MANTRA OM’s DeFi services and overall platform.
Looking at MANTRA OM’s historical performance, the coin has dramatically recovered from its all-time low of $0.01728, recorded on October 12, 2023. Since then, it has appreciated by over 6100%, illustrating a significant turnaround in market sentiment and investor confidence. This rally from the lows to the new highs reflects a broader market recovery and potentially positive developments specific to the MANTRA OM project, such as successful network upgrades. The trajectory shown in the 24-hour chart is just a small segment of this longer-term growth narrative.
MANTRA (OM) Price Analysis: Moving Average Convergence Divergence
The 4-hour MANTRA (OM) price chart showcases a compelling Moving Average Convergence Divergence (MACD) analysis, offering insights into the coin’s momentum and potential trend direction. The MACD line, currently at approximately 0.038893, has crossed above the signal line, which sits at around 0.023918. This crossover is a classic bullish signal, indicating increasing upward momentum and the likelihood of further price appreciation.
um and the likelihood of further price appreciation.
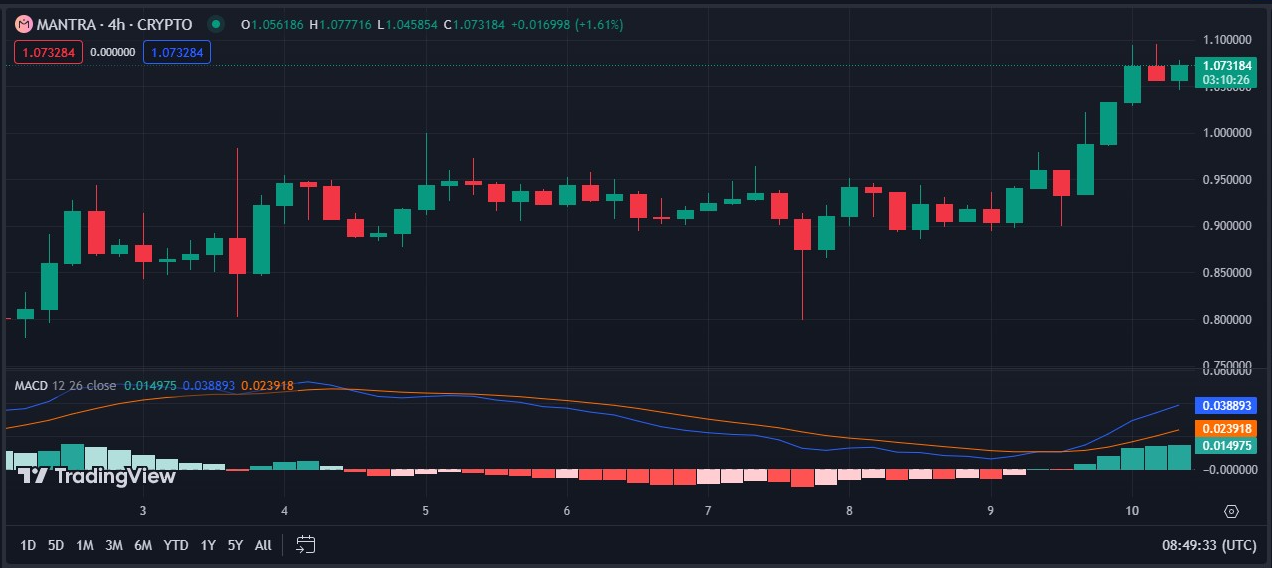
Additionally, the histogram further supports this bullish outlook. The histogram bars are green and have been growing in size, reflecting the widening gap between the MACD line and the signal line. The current histogram value is 0.014975, and the increasing positive values indicate strengthening bullish momentum. The histogram’s behavior aligns with the recent price movements, where the coin has been on an upward trajectory, thus validating the bullish crossover observed in the MACD lines.
MANTRA (OM) Price Analysis: Relative Strength Index (RSI)
The Relative Strength Index (RSI) on the 4-hour price chart for MANTRA OM (OM) reveals significant insights into the current market sentiment. The RSI, which measures the speed and change of price movements, is a momentum oscillator that ranges from 0 to 100. In the 4-hour chart, the RSI is 68.73, just below the overbought threshold of 70. This indicates that the asset is approaching overbought territory, suggesting that the recent upward momentum might be nearing a peak.

Throughout the observed period, the RSI has shown a consistent upward trend, reflecting the strong bullish sentiment in the market. The RSI dipped to a low near 40 earlier in the period, indicating a neutral to slightly oversold condition followed by a substantial upward movement. This progression from lower levels to its current high of 68.73 demonstrates increasing buying pressure and investor confidence in MANTRA OM. The RSI’s ascent is aligned with the price increase, confirming the strength of the bullish trend.
Furthermore, the RSI’s proximity to the overbought level warrants caution. While the upward momentum is strong, a reading near 70 often suggests that the asset might be overbought, and a potential pullback could be on the horizon.
MANTRA (OM) Price Analysis: Awesome Oscillator (AO)
Interestingly, the Awesome Oscillator (AO) on the 4-hour price chart for MANTRA OM (OM) also reveals a clear picture of the current market momentum. The AO oscillates around the zero line and indicates trend strength and direction by comparing recent market momentum to a broader period. The histogram currently displays a series of green bars, with the latest value at 0.097166. This positive reading and the increasing height of the green bars underscore the prevailing bullish momentum, suggesting that the short-term trend is significantly more robust.

The transition from red to green bars on the AO is a critical indicator of changing market sentiment. During the initial part of the chart, the red bars indicate bearish momentum, which gradually diminishes as the bars decrease in height. This shift is followed by a consistent appearance of green bars, signifying a strong upward momentum. The increasing height of these green bars illustrates that the bullish sentiment is present and strengthening, with each new bar reinforcing the upward trend.
MANTRA (OM) Price Prediction 2024-2030
| Price Prediction | Potential Low ($) | Average Price ($) | Potential High ($) |
| 2024 | $0.7722 | $0.8533 | $1.10 |
| 2025 | $1.08 | $1.12 | $1.34 |
| 2026 | $1.51 | $1.57 | $1.87 |
| 2027 | $2.17 | $2.24 | $2.61 |
| 2028 | $3.27 | $3.38 | $3.75 |
| 2029 | $4.74 | $4.91 | $5.69 |
| 2030 | $6.80 | $6.99 | $8.25 |
MANTRA (OM) Price Prediction 2024
In 2024, the price of 1 MANTRA is projected to reach a minimum level of $0.7722. Throughout the year, the OM price could achieve a maximum level of $1.10, with an average price of approximately $0.8533.
MANTRA (OM) Price Prediction 2025
In 2025, the price of MANTRA is forecasted to reach a minimum value of $1.08. Throughout the year, the MANTRA price is expected to attain a maximum value of $1.34, with an average trading price of $1.12.
MANTRA (OM) Price Prediction 2026
Based on our comprehensive technical analysis of historical price data for OM, the price of MANTRA in 2026 is anticipated to reach a minimum level of $1.51. The OM price could attain a maximum level of $1.87, with an average trading price of $1.57 throughout the year.
MANTRA (OM) Price Prediction 2027
The price of MANTRA is projected to reach a minimum level of $2.17 in 2027. According to our analysis, the OM price could achieve a maximum level of $2.61, with an average forecasted price of $2.24.
MANTRA (OM) Price Prediction 2028
According to the forecast price and technical analysis, the price of MANTRA in 2028 is expected to reach a minimum level of $3.27. The OM price could climb to a maximum level of $3.75, with an average trading price of $3.38.
MANTRA (OM) Price Prediction 2029
The price of MANTRA is expected to reach a minimum level of $4.74 in 2029. Based on our analysis, the OM price could rise to a maximum level of $5.69, with an average forecasted price of $4.91.
MANTRA (OM) Price Prediction 2030
Based on our detailed technical analysis of past price data for OM, the price of MANTRA in 2030 is anticipated to reach a minimum value of $6.80. The price of MANTRA could reach a maximum of $8.25, with an average trading value of $6.99 in USD.
FAQs
MANTRA OM (OM) is a decentralized finance (DeFi) platform leveraging blockchain technology to offer financial services such as staking, lending, and governance. It emphasizes community involvement, allowing token holders to participate in decision-making. OM tokens are used for transactions, governance, and incentives.
To buy MANTRA (OM), create an account on a reliable cryptocurrency exchange that supports OM trading. Deposit funds into your account, search for OM, and execute a buy order. Ensure you transfer the purchased OM tokens to a secure wallet for safekeeping.
Coin Edition analysis forecasts OM tokens to reach a peak of $8.25 by 2030. However, investors should invest carefully and monitor it to have a hedge.
The highest price paid for MANTRA (OM) was $1.09, recorded on June 10, 2024.
OM has a circulating supply of 793,991,274 OM coins and a total supply of 888,888,888 OM.
The OM token price is poised to continue its healthy upward movement, surpassing the crucial threshold at $1.09. According to our analysis, the OM token is envisioned to surpass its all-time high mark by the end of 2024.
The lowest price of NOT is $0.01728, according to CoinMarketcap’s data.
The founders of MANTRA (OM) are John Patrick Mullin, Rodrigo Quan, and Will Corkin. They established the platform with a focus on decentralized finance and community governance.
MANTRA (OM) was launched in 2020.
To store MANTRA (OM), use a compatible cryptocurrency wallet such as Ledger (hardware wallet) or MetaMask (software wallet). Ensure the wallet supports ERC-20 tokens, transfer OM tokens from the exchange to your wallet address, and securely back up your wallet’s private keys.
The price of OM is forecasted to hit the $1.10 zone in 2024.
There is a possibility of OM reaching a maximum value of $1.34, by 2025,
By 2026, MANTRA’s valuation might ascend to a peak of $1.87.
Looking ahead to 2027, NOT is expected to achieve a maximum valuation of up to $2.61.
By 2028, analysis shows that the maximum valuation of OM tokens will peak at $3.75.
The maximum valuation of OM tokens is predicted to hit a maximum of $5.69 in 2029.
Coin Edition analysis forecasts OM tokens to reach a maximum valuation of $8.25
Disclaimer: The information presented in this article is for informational and educational purposes only. The article does not constitute financial advice or advice of any kind. Coin Edition is not responsible for any losses incurred as a result of the utilization of content, products, or services mentioned. Readers are advised to exercise caution before taking any action related to the company.
 Price Prediction 2024-2030: Will NEO Price Hit $30 Soon?")
 Price Prediction 2024-2030: Will SUI Price Hit $5 Soon?")
 Price Prediction 2024-2030: Will ICP Price Hit $20 Soon?")

 Price Prediction 2024-2030: Will APE Price Hit $5 Soon?")